Once you’ve learned what Bitcoin and Ethereum are, the next step is understanding how to read their price charts. At first glance, these charts may look complicated — but with just a few basic tools, you’ll quickly start spotting patterns and making sense of price moves.
1. What Is a Crypto Chart?
A crypto chart is a graphical representation of a coin’s price over time.
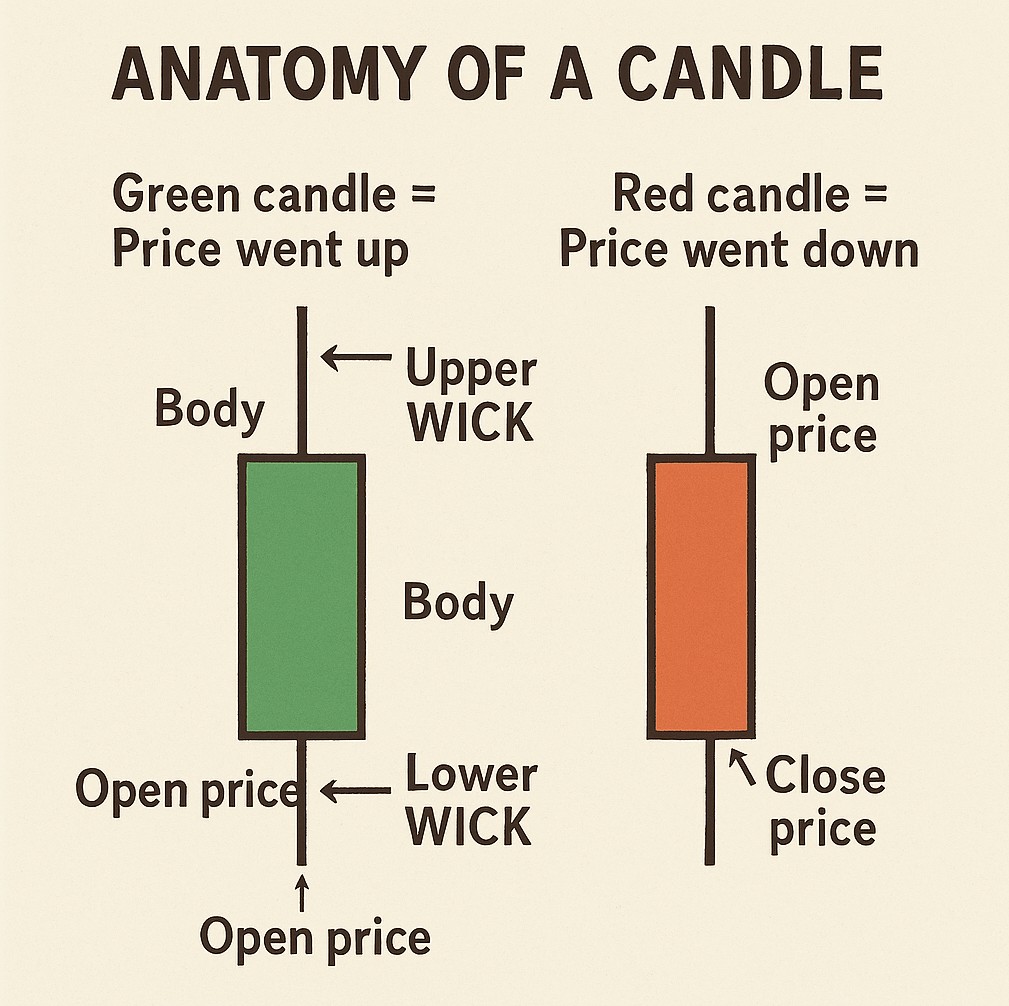
Most people use candlestick charts — a type of chart that shows:
- Open price (when the period started)
- Close price (when it ended)
- High and Low during that time
Each “candlestick” represents a period: 1 minute, 5 minutes, 1 hour, 1 day, etc.
Green candle = price went up
Red candle = price went down
2. Timeframes Matter
Depending on your goal, you’ll want to look at different timeframes:
- Short-term (5min, 15min) → good for traders
- Mid-term (1H, 4H) → swing traders
- Long-term (1D, 1W) → investors, trend analysis
For beginners, I recommend starting with the 1-day (1D) chart. It helps filter out short-term noise and shows broader trends.
3. Key Terms You’ll See
- Support: A price level where buying interest is strong enough to stop the price from falling further.
- Resistance: A price level where selling pressure tends to stop the price from rising.
- Volume: Shows how much of the coin is being traded. High volume = strong interest.
- Moving Averages (MA): Smooth out price trends over time. Popular ones are MA 20, MA 50, and MA 200.
4. Basic Patterns to Watch For
You don’t need to memorize every chart pattern, but here are a few helpful ones to start with:
- Uptrend: Higher highs and higher lows → price is rising
- Downtrend: Lower highs and lower lows → price is falling
- Consolidation: Price moves in a tight range — may be preparing for a breakout
Here’s a simplified chart to help you understand what these patterns look like:
In this image:
- Green and red candles reflect price movement.
- Horizontal lines mark possible support/resistance zones.
- Curved lines show moving averages (trend indicators).
Don’t worry if it looks overwhelming at first — just focus on spotting direction and big swings.
5. Tools You Can Use
Here are some beginner-friendly platforms for charting crypto:
- TradingView – industry standard, with customizable indicators
- CoinMarketCap – great for quick price reference
- Binance, Upbit, Bybit – built-in charts for actual trades
You don’t need to pay for anything to get started — most features are free.
Reading charts isn’t about predicting the future perfectly. It’s about recognizing patterns, understanding momentum, and staying calm when the market moves fast.
Start with simple tools and long-term charts. With time and repetition, you’ll develop your own way of reading the market.